
 Introduction to
Naval Weapons Engineering
Introduction to
Naval Weapons EngineeringIntroduction to SONAR
SONAR (sound navigation and ranging) systems have many similarities
to RADAR and electro-optical systems. Again, detection is based
on the propagation of waves between the target and detector.
There are active sonar systems, where the wave propagates from
the transmitter to the target and back to the receiver, analogous
to pulse-echo radar. There are also passive sonar systems, where
the target is the source of the energy which propagates to the
receiver, analogous to passive infrared detection. Therefore,
a great deal of what has been discussed about these systems will
also apply to sonar. Sonar, however, differs fundamentally from
radar and electro-optics because the energy is transferred by
acoustics waves propagating in water. So we first begin by discussing
the characteristics of acoustic waves.
Acoustic Waves
The term acoustic refers to sound, either in water or
air. A more precise terminology would be to label them as longitudinal
waves. If we consider a string of objects, like weights, connected
by springs, there will be two possible ways of propagating a disturbance
down the string. The first method is to displace the weight in
a direction perpendicular to the string. This will create a transverse
wave. As the weight is moved off the axis, the springs from the
adjacent weight will exert a restoring force that pulls it back
on axis. The other method is to displace the weights along the
axis of the string. This creates a longitudinal wave. Again
the restoring force will tend to push the weight back into place.
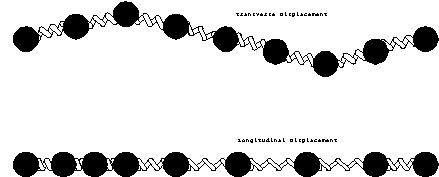
Longitudinal Waves.
Water can be modeled as this string of weights connected by springs,
but of course, it would be in three dimensions. The weights are
the molecules of water, and the springs are the inter-molecular
forces that tend to keep water together, but separated from each
other. In other words, if you try to pull the water molecules
apart from each other there will be a resistance. On the other
hand if you try to push them closer together, there will also
be resistance. So our model seems plausible. Therefore, we will
call the longitudinal wave in water an acoustic wave. The disturbance
of the medium which propagates is the distance between molecules.
However this cannot be measured directly.
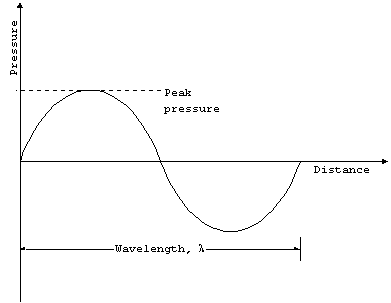
When water molecules are pushed or pulled apart, they
exert a restoring force that resists the motion. Considering
an extended body of water, the force will be felt locally as pressure,
or force per unit area. So the fundamental parameter of an acoustic
wave is pressure. The amplitude of the wave will be the peak
pressure reached in one cycle.
Propagation Speed
For a non-dispersive medium, which water is to some extent,
we would also expect the same type of relationship between wavelength
and frequency as with electromagnetic waves. The only difference
is that the speed of propagation is slower, on the order of 1500
m/s in water, and it is no longer a constant. The speed of propagation
depends on the ambient temperature, pressure and salinity of the
water. Therefore we can write
fl = c(T,p,S)
where c(T,p,S) is the speed of propagation as a function of temperature
(T), pressure (p) and salinity (S).
The speed of propagation is a fairly complicated function,
and the effect of these three independent parameters are best
stated as thumbrules:
1o C increase in temperature
3 m/s increase in speed.
100 meters of depth increase
1.7 m/s increase in speed.
1 ppt (part per thousand) increase in salinity
1.3 m/s increase in speed.
By far the greatest variation occurs in the ambient temperature.
Changes by as much as 30o C are possible in the water
in which a submarine operates. The equivalent change in depth
which would change the propagation speed by the same amount is
more than 5000 ft. Variations in salinity are limited to regions
where fresh and salt water mix, which are normally beyond the
regions where ASW operations take place.
Sound Pressure Level (SPL)
The fundamental parameters of an acoustic wave are the
amplitude, which is a pressure, and the wavelength (or frequency).
Pressure has units of force/area or in SI (system international)
units, N/m2. The SI unit of pressure is the Pascal
(Pa), where 1 Pa = 1 N/m2.
Unfortunately, most readers are not comfortable with this
unit, so here is most of the commonly encountered units of pressure
and their equivalents
Table 1. Common Units of Pressure.
| Units | Normal atmospheric pressure |
| atmospheres (atm) | 1 |
| bar | 1.01325 |
| Pascal (Pa) | 1.01325 x 10⁵ |
| Pounds/in2 (psi) |
14.6960 |
| Inches Hg | 29.9213 |
| mm of Hg (torr) | 760 |
| Inches of Water | 406.8 |
| dynes/cm2 | 1.01325 x 10⁶ |
Similarly to radar and electro-optics, we will need to describe
the energy flow in an acoustic wave. The power per unit area
in an acoustic wave varies as the square of the pressure. Apparently,
in order to maximize confusion, the term intensity, I, refers
to power per unit area, and therefore we write the proportionality:
I p2.
For working purposes, we can use a term called the sound pressure
level, or SPL, which is defined as:
SPL 20 Log[p/(1 mPa)]
where 1 mPa is the reference value,
similar to the way 1 mW is used in the definition of dBm. Therefore
the exact coefficients of the proportionality are irrelevant,
since SPL is a ratio. You should note the factor of 20 in front
instead of the usual 10 used for decibels. Recall that decibels
express a ratio of powers, which in this case are proportional
to the square of pressure. Using the properties of logarithms,
the exponent is brought down in front and multiplies the normal
factor of 10. For example, 10 Log(x2) = 20 Log(x).
Acoustic analysis is done with logarithms in order to
handle the wide range of values. Later when we write a maximum
range equation, it will look totally different because everything
will be expressed in decibels. As the first example, consider
two acoustic waves. If they are of equal strength, they can be
superimposed to create a signal with twice the intensity. In logarithms,
this means the SPL will increase by +3 dB, since:
SPL1 = 20 Log(p1/1 mPa)=
10 Log {p12/(1 mPa)2}
SPL2 = 20 Log{p2/(1 mPa)}=
10 Log { p22/(1 mPa)2}
SPL2 = 10 Log{ 2p12/(1 mPa)2}
SPL2 = 10 Log{p12/(1 mPa)2}
+ 10 Log(2)
SPL2 = SPL1 + 10 Log(2), but 10 Log(2)
= + 3,
SPL2 = SPL1 + 3
If you need to add together two source levels (SPL's),
you cannot use ordinary addition, as the example shows. For instance,
if SPL1 = SPL2 = 60 dB, you cannot combine
the levels to get SPL 120 dB! The correct answer is 60 dB combined
with 60 dB gives 63 dB. A shorthand notation that will remind
us to apply special means to combine levels is the symbol "."
For example, the correct equation should be
60 dB 60 dB = 63 dB.
Although tedious, we will now develop a systematic method for
combining levels since we will need it shortly.
Combining Sound Pressure Levels
There are two common methods for combining sound pressure
levels.
Calculator method (brute force). When two levels combine, you
cannot simply add the peak pressures in the waves. You can only
add the intensity which varies as pressure squared. To combine
two levels, you must first "undo" the logarithm, add
the pressure squared terms, then re-apply the logarithm. In detail:
SPL1 = 10 Log{ p12/(1 mPa)2}
p12/(1 mPa)2
= 10SPL1/10
SPL = 10 Log{ p12/(1 mPa)2
+ p22/(1 mPa)2}
SPL = 10 Log{10SPL1/10 + 10SPL2/10}
Let's see if it works on the prototypical problem:
60 dB 60 dB = 10 Log{ 106 + 106} = 63 dB
Tabular method (easy way). When combining two sound pressure levels,
you first find the difference between the levels, and then use
the table to find the amount which is added to the larger of the
two.
Table 2. Combining Decibels.
| Difference between sound pressure levels (SPL) | Add this amount to larger: |
| 0-1 | 3 |
| 2-4 | 2 |
| 5-9 | 1 |
| >9 | 0 |
Again, to find 60 dB 60 dB, the difference between the two is
zero add 3 to the larger:
60 dB 60 dB = 60 dB + 3 dB = 63 dB
Sources
Active Sonar
In an active sonar system, the source of the acoustic
wave is part of the sonar system. The electrical energy from
the transmitter must be converted into acoustic energy. The generic
term for the device which accomplishes this task is transducer,
which means something that converts the form of energy. If the
transducer can only receive it is called a hydrophone,
and if can only transmit it is called a projector. In many
situations, the transducer can work both as transmitting and receiving
device, which is the usual case for sonar, so it is just called
a transducer. The output of the transducer is measured as an
SPL, and is termed the source level (SL).
For a given total power output, the intensity will be
reduced as a function of range because the same total power must
be distributed over a larger area. Therefore, the SPL, which
is the logarithm of intensity will drop with range from the source.
We must measure SPL at a standard range from the source in order
to be able to make meaningful comparisons. That standard range
is one meter. Therefore SL is specified by an SPL measured at
1 m from the source. Sometimes, the notation will include a reference
to the pressure unit and measurement distance. For example, SL
= 145 dB//ref:1 mPa @ 1m, refers to
a source level using a reference of 1 mPa
measured at one meter. Here, we will omit this cumbersome notation
since all source levels will specified using this reference.
Passive Sonar
In a passive sonar system, the source is the target itself.
The same terminology applies to passive sources, namely the source
level, SL. Of course, the source level is generally not known
beforehand. However, source levels for hostile targets can be
measured through intelligence gathering efforts, which cannot
be discussed here. Passive sources fall into two main categories:
broadband and narrowband sources.
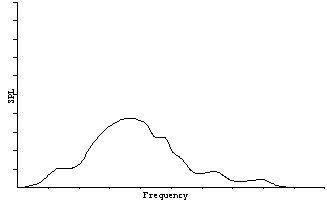
Broadband sources, all the name suggest, create acoustic
energy over a wide range of frequencies. This is similar to the
thermal source in electro-optics. Typical broadband sources are
noise from either the propeller/shaft, flow noise and some propulsion
systems (example: steam). Noise from the propeller and shaft
is generally at low frequency, meaning less than 1000 Hz. Furthermore,
the rate of rotation can amplitude modulate the noise, which can
be detected and demodulated to measure the shaft or propeller
blade rate.
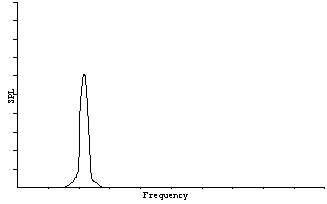
Narrowband sources radiate within a small band about a particular
frequencies, or class of frequencies. Typical sources are the
various pieces of machinery found in every ship. For example,
pumps, motors, electrical generation equipment and propulsion
systems. When specifying narrowband sources, it is important to
also specify the frequency at which it occurs.
Ambient Noise
The introduction of noise from other sources is a significant
factor in sonar performance. There are a wide variety of noise
sources present in the underwater environment, but the main, consistent
contribution comes from only a few types. Ambient noise, unlike
other sources, does not come from a particular direction or source.
The noise level is the same everywhere in the local area. Therefore
the SPL will be the same everywhere and it is not necessary to
specify the range at which it was measured at (cf. Source level).
So the ambient noise is specified as a particular SPL.
The most obvious contribution to the ambient noise is
the action occurring on the surface of the ocean. The greater
the size of the waves, the greater the ambient noise contribution.
The waves are driven by the winds, so there is a direct correspondence
between the steady wind speed and the sea state. The condition
of the ocean surface is quantified by the sea state, which is
a number ranging from 0-9. The Beaufort Wind Scale which ranges
from 0-12 is the standard measure of the consistent wind speed.
Table 3. Beaufort Wind Scale and Sea States.
| Beaufort | Wind speed (knots) | Wave height (meters) | Sea State |
| 0 | <1 | 0 | 0 |
| 1 | 1-3 |
||
| 2 | 4-6 |
0-0.1 | 1 |
| 3 | 7-10 |
0.1-0.5 | 2 |
| 4 | 11-16 | 0.5-1.25 | 3 |
| 5 | 17-21 | 1.25-2.5 | 4 |
| 6 | 22-27 | 2.5-4 | 5 |
| 7 | 28-33 | 4-6 | 6 |
| 8 | 34-40 | ||
| 9 | 41-47 | ||
| 10 | 48-55 | 6-9 | 7 |
| 11 | 56-63 | 9-14 | 8 |
| 12 | >64 | >14 | 9 |
The greater the wind speed or sea state, obviously the greater
the ambient noise contribution. The frequency of the noise from
sea state tends to be greater than 300 Hz.
The second main contribution to ambient noise comes from
shipping in general. In regions where there are many transiting
ships, the ambient noise will be increased substantially. This
noise, in contrast to the noise from sea state, will be at low
frequency (< 300 Hz). The amount of shipping traffic can be
estimated by broad geographical considerations. For the purposes
of estimating the ambient noise, we will arbitrarily describe
locations as falling into one of six categories:
Table 4. Shipping Levels.
| Category | Description |
| Very remote | No other ships present for many miles. |
| Remote | Infrequent distant ships. |
| Quiet | Occasional ship nearby. |
| Shipping Lanes | Many ships nearby. |
| Heavy traffic (deep water) | Constant passing of ships nearby, offshore. |
| Heavy traffic (shallow water) |
Constant passing of ships nearby, inshore. |
The two contributions to ambient noise, sea state and
shipping can be predicted using the categories we have just defined.
The noise as a function of frequency is found on a graph from
a series of measurements called the Wenz curves.
Figure 5. Modified Wenz Curves.
To find the combined ambient noise level (AN), you must combine
the sound pressure levels from the two curves using:
AN = Shipping (SPL) Sea State (SPL).
Example: predict the ambient noise at 300 Hz from shipping lanes
and sea state 2.
The shipping noise is 65 dB
The sea state noise is 62 dB
65 dB 62 dB = 65 + 2 = 67 dB (tabular method)
AN = 67 dB
The third possible ambient noise source is biologics,
meaning sea-life. These are as widely varied as they are unpredictable.
One common source is snapping shrimp. Others include whales
and dolphins. It is impossible to estimate the contribution from
biologics to the ambient noise beforehand, therefore the effects
are only known in-situ.
Self-Noise
There is another kind of noise in acoustic systems, that
comes from the electronics itself, noise from the platform it
is on, or from the flow of water across the receiving array itself.
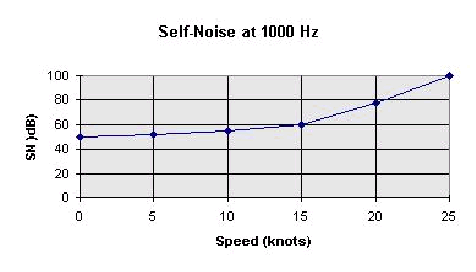
This is called self-noise, SN. Self-noise will have a minimum
value which is present regardless of the speed that the array
is traveling through the water, and then the self noise will increase
due to flow noise and the increase in noise from the platform
which carries it. Self noise is specified as a SPL, and has a
frequency and speed dependence.
Total Noise
The ambient and self-noise must be combined, using the
special method for combing sound pressure levels. We define the
total noise level, NL as
NL AN SN
Detection of Acoustic Energy
Beam-forming
Transducers (or hydrophones) are used to receive acoustic
energy. If they are designed to receive equally well in all directions,
they are called omni-directional. The transducer can be constructed
with some directionality in which case it will have some range
of angles from which it can receive energy which will be its beamwidth,
q. The beamwidth can only be made
as small as the diffraction limit, meaning
q 2l/D
where l is the wavelength and D is
the diameter of the aperture or face of the transducer. Transducers
are usually small devices, on the order of 10 cm. However,
they can be combined into arrays, similarly to the way simple
antenna elements are used in phased array radar. Now the size
of the array, or aperture, L, will determine the beamwidth.
q 2l/L.
When receiving, the narrow beamwidth will allow the array to reject
more interfering noise, since the ambient noise comes from all
directions. This is completely analogous to radar antenna gain,
and we have a similar expression in sonar. It is a logarithmic
term called the directivity index, DI. It is roughly the equivalent
of antenna gain in decibels (i.e. 10 Log (G)). However, in sonar
this term is applied only to the reception of energy, since the
definition of SL accounts for the gain achieved in transmission.
As an example of directivity index, consider a linear
array of hydrophones with overall length L. The array will form
a beam perpendicular to the array with beamwidth, q 2l/L.
The two-dimensional gain G = 2p/q
pL/l. Therefore,
the directivity index DI 10 Log (pL/l).
The more precise value for this and the circular aperture of
diameter D is given below. Note that the DI for the circular
plate represents the three dimensional beam-forming whereas the
linear array only forms a beam in a plane. The factor in front
is 20 instead of 10 for this reason.
Table 5. Array directivities.
| Array/Shape | Beamwidth, q | DI |
| Circular plate, diameter D | (2.4)l/D | 20 Log (pD/l) |
| Linear array, length L | 2l/L | 10 Log (2L/l) |
There are two limiting cases that apply to arrays of transducers:
Low frequency limit. In this case, the large wavelength causes
a very large beamwidth and all directionality is lost. DI approaches
0. This occurs, for example when 2L = lmax,
or
fmin = c/2L
fmax = c/d
High frequency limit. In this case, the wavelength becomes too
short for effective steering of the beam. This condition occurs
when the spacing between elements in the array is the same as
the wavelength: d = l. This sets an
upper limit on frequency,
Based on this analysis, the best overall frequency response
would come from a sonar array that was very large with a large
number of closely spaced transducers. Of course, this is also
the most expensive, and will require the most processing capability
for beam-forming.
Detection Criterion
Just like in the previous situations, the criterion for
detection requires the amount of power which is collected by the
receiver to exceed the noise level by some threshold. The ratio
of signal-to-noise in logarithmic form is the SNR. The minimum
SNR for detection is called the detection threshold, DT. Therefore
detection generally occurs, meaning more than 50% of the time,
whenever
SNR > DT.
We have already discussed the source of acoustic energy and the
noise level, but have yet to describe the relationship between
them. For now, describe the signal loss from source to receiver
as transmission loss, TL. The transmission loss term includes
all the effects of the energy spreading out, and attenuation,
and various other effects which will be the main topic of discussion
in the next two chapters. It is this term, in fact, which makes
sonar much more difficult to predict and operate as compared to
radar, for example.
So now the SNR at the receiver can be written explicitly for
a passive system (which has a one-way transmission):
SNR = SL + DI - TL - NL
where:
SL = source level
TL = transmission loss
NL = noise level (AN SN)
DI = directivity index
For an active system, we have on additional term, which
describes the reflection of energy from the target, called the
target strength, TS. The target strength acts as a source level
after reflection, and therefore includes any directional effects
of reflection. The target strength is a function of the target
size, surface material and shape in the same way that radar cross
section varies. Also note for the active system, there is a two-way
transmission loss, therefore
SNR = SL - TL + TS - TL - NL+ DI,
SNR = SL - 2TL + TS - NL + DI
Although these terms look similar in active and passive
systems the values for each term will in general be quite different.
You should note that these equations use ordinary addition
and subtraction even while working with sound pressure levels.
This is absolutely correct. We are not combining sound pressure
levels in these equations, we are actually multiplying and dividing
terms. Recall that SNR is the logarithmic equivalent of the
signal-to-noise ratio. When you take the logarithm, the division
becomes subtraction. Likewise, terms which multiply, like the
equivalent of gain, are now added. This is usually a source of
great confusion: when to add/subtract and when to combine sound
pressure levels using the special methods above. Here, we have
been explicit in the use of the symbol "" whenever the
special method is used.