
 Introduction to
Naval Weapons Engineering
Introduction to
Naval Weapons EngineeringAdvanced Radar Systems
Radial Velocity Discrimination
In many circumstances, it is beneficial to know both the
range and the radial velocity of the target. Since the relative
radial velocity is the range rate, a measurement of the radial
velocity can be used to predict the target's range in the near
future. For example, it allows the prediction of when a target
will be inside the effective range of a weapon system. Radial
velocity discrimination can also be used to eliminate unnecessary
targets from the display. For example, sea clutter or buildings.
There are three methods used which can give simultaneous measurement
of range and range rate.
Differentiation
This system simply measures the range at fixed intervals
and computes the rate of change between the measurements. For
example, if a target is at 1500 m for the first measurement and
at 1492 m for the next measurement made 1 sec later, the range
rate is -8 m/s. Light detection and ranging (LIDAR) systems use
this method. Accuracy is improved by taken several quick measurements
and computing the average rate of change. The intervals cannot
be chosen to be too small however, since the target must be able
to change range during the measurement interval.
Moving Target Indicator (MTI)
This system measures changes in the phase of the returned
signal to determine motion of the target. In order to measure
the phase, a sample of the transmitter pulse is fed into a phase
comparator, which also samples the return signal.
The output of the phase comparator is used to modulate the display
information. Returns will be the largest and positive when they
are in-phase the largest negative value when out of phase.

Figure 1. Phase comparison
output.
When the range to a target is changing, the phase comparison output
will be varying between its extreme values, as well as moving
in range. One full cycle of phase shift is completed as the range
changes by one-half wavelength of the radar. This is because
the radar signal travels both to and from the target, so that
the change total distance traveled by the radar pulse changes
by a factor of two. For a typical radar wavelength of 3 cm, it
is clear that the phase comparison output will be rapidly varying
for targets whose range is changing.
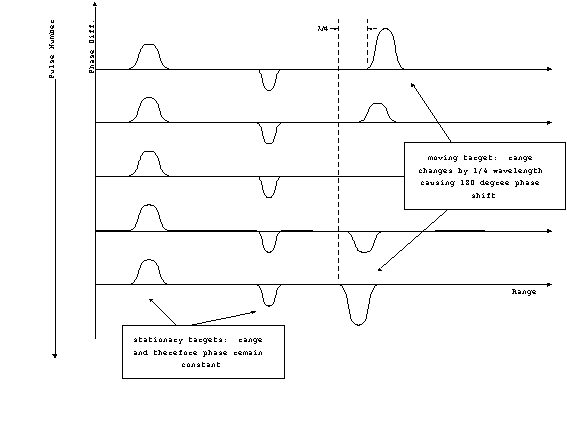
Figure 2. Five sequential
returns from pulse comparison output.
The fact that stationary targets have a fixed value of phase difference
can be exploited to remove them from the display. This is accomplished
by a cancellation circuit. The MTI processor takes a sample from
the phase comparison output and averages it over a few cycles.
Moving targets will average to zero, while stationary targets
will have non-zero averages. The average signal is then subtracted
from the output before it is displayed, thereby canceling out
the stationary targets.
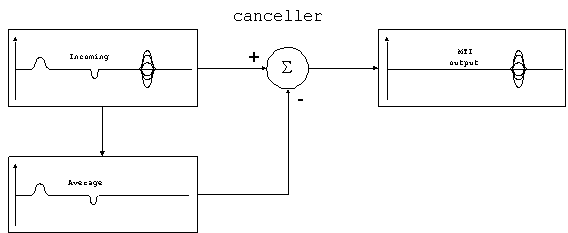
Figure 3. Cancellation
circuit of MTI processor.
What is meant by stationary targets are those returns which are
not changing in range. For moving transmitters, of course, returns
from fixed objects on the ground will be changing in range and
therefore displayed. MTI systems for moving transmitters must
provide a modified input to the phase comparator, which includes
the phase advance associated with the motion of the transmitter.
Pulse Doppler Radar
This system adds additional processing equipment to the
basic pulsed radar system. A sample of the transmitted signal
is directed to mixer, which also samples the output from the receiver.
The output of the mixer is the Doppler shift, Df.
The Doppler shift is passed to a filter which modifies the display
information accordingly.
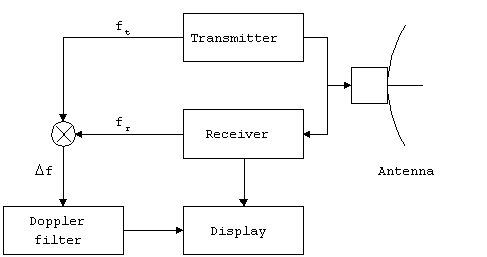
Figure 4. Pulsed Doppler radar
system.
The most common application is to color code the return information
on the PPI display. The Doppler shift is sorted into categories,
for example positive, zero and negative, which are then associated
with colors. In this example, only three colors are used: white,
grey and black.
Pulsed Doppler radar systems are used in numerous miltary
applications. They are also the standard weather radar throughout
the country. The pulsed Doppler radar can detect and graphically
display information about the relative motion of winds inside
of storm cells and has proved useful in detecting tornadoes.
A Doppler velocity display of a tornado will show the two colors
which correspond to opposite directions of motion side-by-side.
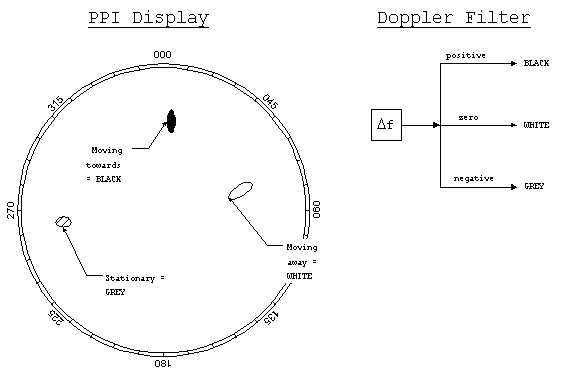
Figure 5. Pulsed Doppler
display.
Limitations
MTI and pulse Doppler radar systems cannot measure velocities
above a certain value, known as the first blind speed or maximum
unambiguous speed. There are two ways to understand this phenomenon.
For MTI systems, the first blind speed occurs when the change
in range between pulses is exactly one-half of the wavelength.
This changes the phase by 3600 which is the same as
00, or no phase shift at all. The target moving at
the first blind speed will appear to be stationary and be canceled
from the display. Since this condition will only be temporary,
it is of no concern.
In pulsed Doppler systems, the radial velocity cannot
be measured above the first blind speed. Consider the spectrum
of the pulsed Doppler radar system. There will be a main lobe
centered on the radar carrier frequency. The bandwidth (BW) of
the main lobe will be determined by the pulse width (PW), from
the fundamental relationship:
BW = 1/(2PW).
Because the cycle is repeated at a frequency equal to the PRF,
there will additional copies of the main lobe at multiple intervals
of the PRF on either side of the carrier frequency. In fact,
all of the information from the return will be repeated at intervals
of PRF, including the Doppler shifted return.

Figure 6. Spectrum of
pulsed Doppler radar.
The only useable portion of this spectrum is the interval between
the main lobe and the first harmonic at fc + PRF.
Therefore only Doppler shifts that fall within this range can
be measured unambiguously. Therefore the condition when the Doppler
shift is equal to the PRF defines the maximum unambiguous speed
that can be measured. From this we derive the maximum unambiguous
speed:
Df = 2s/l
= PRF
Sunamb = lPRF/2
You will note that this is also the same condition described
for MTI systems, namely when the target moves one-half wavelength
in the period PRT:
sblind * PRT = l/2
sblind = lPRF/2.
From the spectrum, it is also apparent that the Doppler shift
must be larger than the bandwidth of the main lobe in order to
be detectable. This defines a minimum detectable speed:
Dfmin = 2smin/l
= 1/(4PW)
smin = l/(8PW).
Example: WSR-88 (NEXRAD) weather radar.
This system operates at 3 GHz (l =
10 cm) and uses a 325 Hz PRF in its normal mode, find the maximum
unambiguous speed this system can measure.
Sunamb = (0.1 m)(325)/2
sunamb = 16.25 m/s or about 37 mph.
There are two ways to fix this problem. The first is
to increase the PRF. Of course, this will reduce the maximum
unambiguous detection range accordingly. The other is to vary
the PRF. Ambiguous returns will vary either in range or velocity,
while accurate ones will not. This does not solve the problem,
but can be used to identify conditions where the target range
is beyond Runamb or when the target radial speed is
beyond sunamb.
Pulse Compression
This is a method which combines the high energy of a long
pulse width with the high resolution of a short pulse width.
The pulse is frequency modulated, which provides a method to
further resolve targets which may have overlapping returns. Since
each part of the pulse has unique frequency, the two returns can
be completely separated. The pulse structure is shown below:
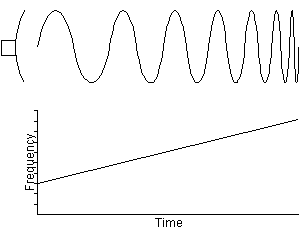
Figure 7. Pulse compression using
frequency modulation.
The receiver is able to separate two or more targets with overlapping
returns on the basis of the frequency. Here is a sample return
showing two targets with separation less than the conventional
range resolution:
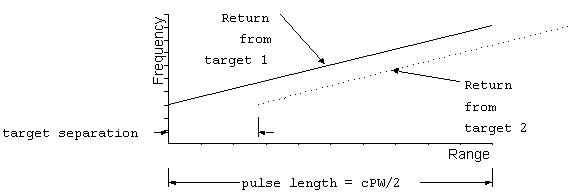
separated by frequency.
When the pulse is frequency modulated in this manner the process
or resolving targets on the basis of frequency is called post-detection
pulse compression, or PDPC. The ability of the receiver to
improve the range resolution over that of the conventional system
is called the pulse compression ratio. For example a pulse
compression ratio of 20:1 means that the system range resolution
is reduced by 1/20 of the conventional system. Alternatively,
the factor of improvement is given the symbol PCR, which can be
used as a number in the range resolution formula, which now becomes:
Rres = c PW/(2 PCR)
The minimum range is NOT improved by the process. The full pulse
width still applies to the transmission, which requires the duplexer
to remained aligned to the transmitter throughout the pulse.
Therefore Rmin is unaffected.
Synthetic Aperture Radar (SAR)
We have already seen that the angular resolution is determined
by the beamwidth of the antenna. At a given range, R, the ability
to resolve objects in the cross-range direction, known as the
cross-range resolution, is calculated by
DRcross = Rq
where q is the beamwidth expressed
in radians. This is merely the arc length swept out by the angle
q at radius R. It is also the width
of the radar beam at the range R. For example, a 60
beamwidth (0.1 radians) will be 10 m wide at a range of 100 m.
For most radar antennas the beamwidth is sufficiently large
so that the cross range resolution is fairly large at normal detection
ranges. As such, these systems cannot resolve the detail of the
objects they detect.
Synthetic aperture radar (SAR) uses the motion of the
transmitter/receiver to generate a large effective aperture. In
order to accomplish this, the system must store several returns
taken while the antenna is moving and then reconstruct them as
if they came simultaneously. If the transmitter/receiver moves
a total distance S during the period of data collection, during
which several return pulses are stored, then the effective aperture
upon reconstruction is also S.
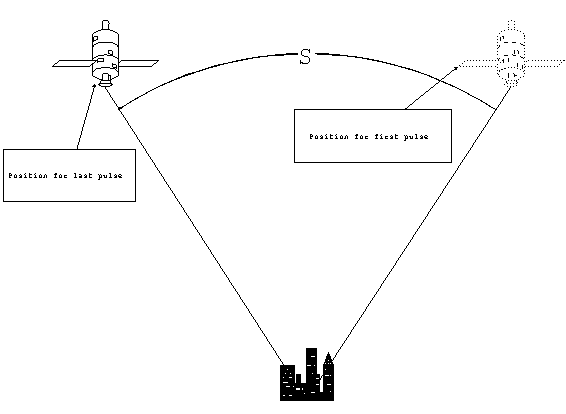
Figure 9. Synthetic aperture.
The large synthetic aperture creates a very narrow beamwidth which
can be calculated by the usual beamwidth formula, substituting
the synthetic aperture for the physical antenna aperture. The
new beamwidth can be used to predict the improved cross-range
resolution:
DRcross R l/S
(SAR)
where: R = target range, S = distance traveled by the transmitter/receiver
during data collection, and l = the
wavelength of the radar.
The most frequent application of SAR is with satellite
radar systems. Because the satellite is traveling at high velocity,
the accuracy of these systems can be made very high. Furthermore,
if the target is fixed in location, the period for data collection
can be made very long without introducing significant error.
Therefore satellite SAR is used for the imaging of fixed objects
like terrain, cities, military bases, etc.
Inverse Synthetic Aperture Radar (ISAR)
It is possible to achieve the same large synthetic aperture
without moving the transmitter/receiver. If the target rotates
by a small amount, it has the same effect as if the transmitter/receiver
were to travel a distance equal to the arc length at the range
R. The figure below illustrates this effect for a yaw angle y
of a ship at range R.
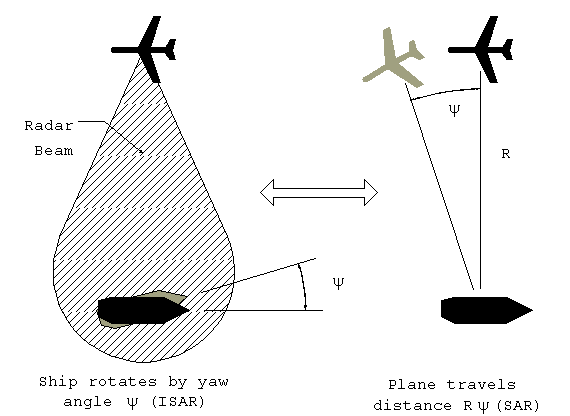
Figure 10. Equivalence
of SAR and ISAR.
Since the effect is the same we can take over the same results
for the cross range resolution, but this time we substitute the
distance Ry for the aperture.
DRcross = R (l/Ry),
the range cancels out to give:
DRcross = l/y
(ISAR)
which is a remarkable result, because it is independent of range!
Example:
Find the cross-range resolution of an ISAR system at 3
GHz, that collects data over a yaw angle of 60 (0.1
radian).
The wavelength, l = 10 cm, so the cross-range
resolution is
DRcross = 0.1 m/0.1
DRcross = 1 m, at any range.
ISAR systems are typically used for long-range imaging
and identification of possible targets. The ISAR platform may
be fixed or moving. The best targets for ISAR are ships which
tend to yaw periodically in the sea state.
It is possible to form a radar beam using a planar array
of simple antenna elements (i.e. dipole antennae). It is easiest
to visualize this system starting with a linear array.
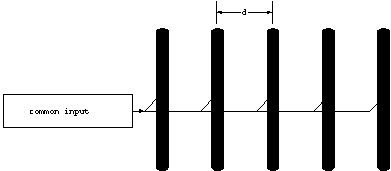
If all of the antennae are driven coherently, meaning at the same
frequency and phase, then the condition of maximum constructive
interference will occur in the two directions perpendicular to
the array axis. Now, if this system is modified to include a
variable phase shift on the input to each element, the condition
of maximum constructive interference can be changed.
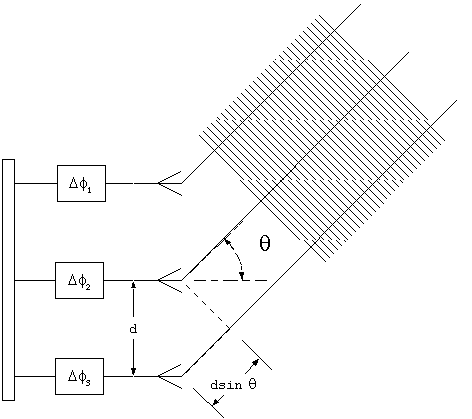
Figure 12. Path length
difference for beam steered off axis.
Here we have a three element linear array, all fed from a common
source, with a variable phase shift at each element. In order
to change the direction of maximum constructive interference by
the angle, q, the phase shifts must
be chosen to exactly compensate for the phase shift created by
the extra distance traveled, d sin(q).
The condition for the phase shift between adjacent elements can
be found from
Dfadj = (2p/l)
d sin(q)
Care must be taken to assign an appropriate
sign to the phase shift. In the example above, the phase of the
signal from antenna element 3 must be advanced relative to element
2, therefore the phase shift is positive.
This same principle may be applied to a planar array.
In this case, the phase shift will steer the beam both in azimuth
and elevation. The phase shifts required may be computed independently
and combined algebraically to give the net phase shift required.
First we must establish the coordinate system. When facing the
array, the upper leftmost element will be the reference with coordinates
(0,0). The elements will be assigned coordinates with the first
number representing the elevation and the second the azimuthal
element number. The general element coordinates will be (e,a),
where:
e = elevation element number
a = azimuthal element number.
When referring to the phase shift at a specific element, it will
be in reference to the element (0,0). Using this system, we chose
the angles to be positive in the directions indicated below:
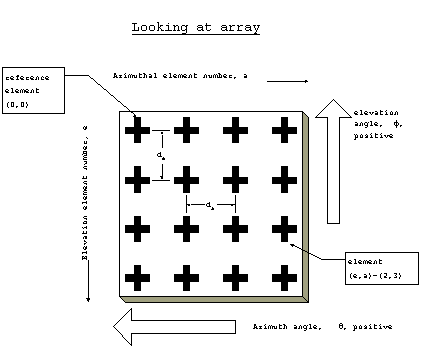
Figure 13. Planar phased array.
The phase shift required to steer the beam to an elevation angle
f (defined so that upwards is positive)
and azimuthal angle q (positive when
to the left as seen looking into the array),
will be
Dfe,a = (2p/l)[
e de sinf + a da
sinq ]
where de and da refer to the element spacing
in the vertical and horizontal directions respectively.