 Introduction to
Naval Weapons Engineering
Electro-Optical Imaging Systems
The Field of View (FOV)
The field-of-view (FOV) is the range of angles from which
the incident radiation can be collected by the detector. The
field of view may be decomposed into its horizontal and vertical
components, labeled as HFOV and VFOV respectively. In both cases
the FOV is determined by a combination of the focal length
of the lens, f, and the size of the field stop, DF.S..
The focal length of a lens is the distance from the center
of the lens to the point where all of the incident radiation (or
light) coming from a source at infinity will be focused. If the
source is at infinity (or very far away), the incident rays of
radiation will be nearly parallel. The lens will refract them
all to the same point, namely the focal point of the lens.
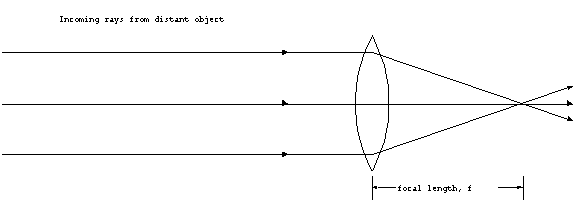
Figure 1. Focal point
of a lens.
The field stop is a device that blocks rays that are beyond its
dimensions from reaching the detecting element(s). The detecting
elements are located at the focal plane, which is usually not
the same location as the focal point. The location of the focal
plane determines at what range objects will be brought into focus.
The field stop is located just before the focal plane. If there
is no physical stop, then the boundaries of the detecting elements
determine the field stop dimensions.
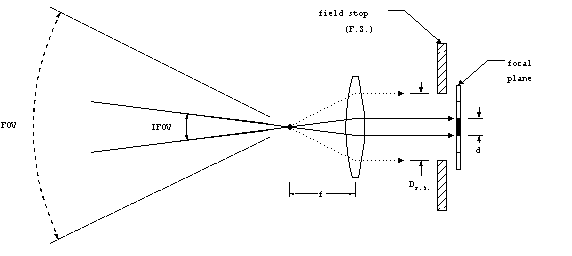
Figure 2. Fields-of-view.
As can be seen from the geometrical construction in figure 2,
the diameter of the field stop, DF.S. affects the FOV.
If the field stop is made smaller, the FOV will be reduced accordingly.
By analogous reasoning, the instantaneous field-of-view (IFOV)
will be affected by the size of the individual detecting element,
d. The IFOV is the range of incident angles seen by a single
detecting element in the focal plane.
The IFOV and FOV can be calculated using trigonometry:

Equation 1Equation 2
For small angles, less than 200, which is generally
true for IFOV, the inverse tangent can be accurately approximated
by tan-1(x) x (radians), in which case:
IFOV d/f, (if d/f <<1).
Equation 3
Example: digital camera. Find the FOV and IFOV for a 35 mm digital
camera with a 50 mm lens, that uses 1152 x 864 resolution.
First, "decode" the terminology:
50 mm lens focal length f = 50 mm.
35 mm the field stop DF.S. = 35 mm (for a conventional
film camera, this is the size of the film).
1152 x 864 resolution there are 1152 pixels in the horizontal
direction and 864 in the vertical.
Therefore, the FOV is calculated using equation (1):
FOV = 2 tan-1(35/2x50) = 38.50
The instantaneous field-of-views, either from equation (2),
or by noting the FOV must be divided by the number of elements
to get the IFOV:
HIFOV (horizontal) = FOV/1152 = 0.030
VIFOV (vertical) = FOV/864 = 0.0450
Depth of Focus
The focal plane must be placed so that objects at the
desired range will be in focus. For any object range, all the
rays from that object will come together at a unique location
beyond the lens. If the object is at a very long range, the rays
will come together at the focal point. At shorter ranges, that
point gets further and further from the lens.
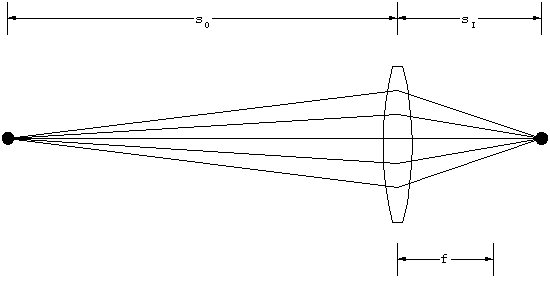
Figure 3. Object and image distances.
The distance of the object in front of the lens, sO,
and the location of the focused image behind the lens, sI,
are related by the Lens Maker's Equation
1/sO + 1/sI = 1/f.
Equation 4
If the focal plane is so located that the object is in perfect
focus, meaning the object and image distances satisfy equation
(4), the question becomes: at what range from the object does
the image become noticeably unfocused? As the object distance
is changed, its image will become spread out on the focal plane.
When the image becomes so spread out that it overlaps the adjacent
detecting elements, the overall image will be distorted. So,
the size of the detecting element determines the limits beyond
which the image is considered to be unfocused. The range of object
distances which satisfy the criterion for making a suitably focused
image is called the depth of focus.
The depth of focus depends initially on the detecting
element size and the focal length. In practice the depth of focused
can be controlled. This is accomplished by the use of an aperture
stop (A.S.). As we have already seen the aperture stop will limit
the amount of flux that is collected. So it would seem that the
largest possible aperture stop is the most beneficial. However,
the larger the aperture stop, the shorter the depth of focus.
This is illustrated by another geometrical construction.
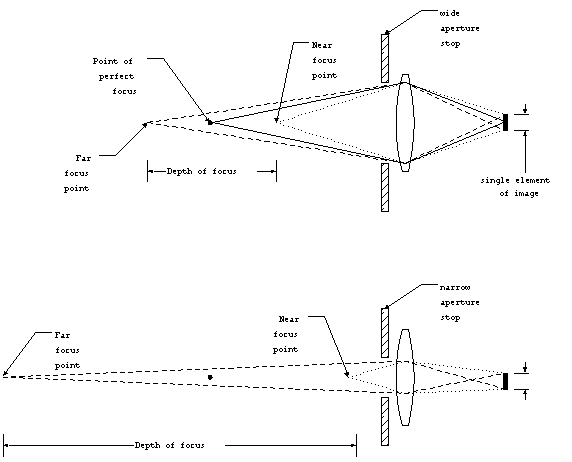
Figure 4. Depth of focus.
By limiting the range of angles at which the rays may enter the
optics, the aperture stop actually improves the depth of focus.
As a trade-off, however, reducing the aperture stop limits the
amount of flux that can be collected by the detecting system,
and therefore would require more sensitive detecting elements
to achieve the same maximum detection range. This is why smaller
apertures require longer exposure times in conventional photography.
Scanning vs. Staring Sensors
In the previous discussion, it was assumed that at the
focal plane, there was an array of detecting elements, one for
each part of the image within the field-of-view. This configuration
is used in staring sensors. The resolution of the object
within the field of view is determined by the IFOV, which can
be found from equations (2) or (3).
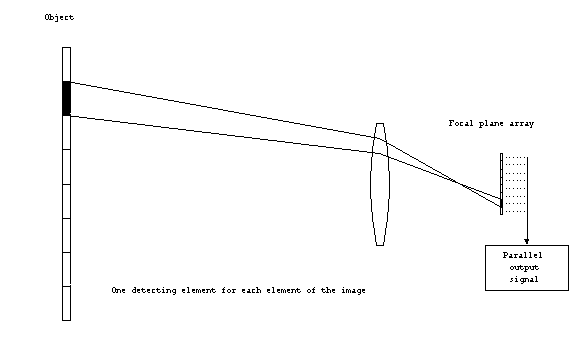
Figure 5. Staring (parallel
scan) system.
All of the detecting elements are simultaneously exposed to the
image from the object, and therefore can produce output in parallel.
The output of the detecting elements is scanned once to create
a complete image, or frame. In standard video, each frame lasts
1/30 of a second. The frame rate is how often the frame is changed,
therefore, the frame rate would be 30 Hz. The frame rate limits
how long each element of the image is incident upon the detecting
element, known as the dwell time, tdwell.
In a staring system, the dwell time is the same as the duration
of the frame, or the reciprocal of the frame rate. Generally,
the longer the dwell time, the more sensitive the detector is.
Alternately, the longer dwell time reduces the electrical bandwidth
and therefore the noise of the detector, which has the same result.
A single detecting element can be used in a scanning system.
In this configuration, some device is used to sequentially scan
the instantaneous field-of-view (here determined by the aperture)
to a single detector. The scanning system might be a rotating
mirror which directs the IFOV onto a single element. The scanning
system might be used in applications where the detecting elements
are very expensive. Since only a single element is used, it is
much cheaper than the typical, 640x400 array of a staring sensor.
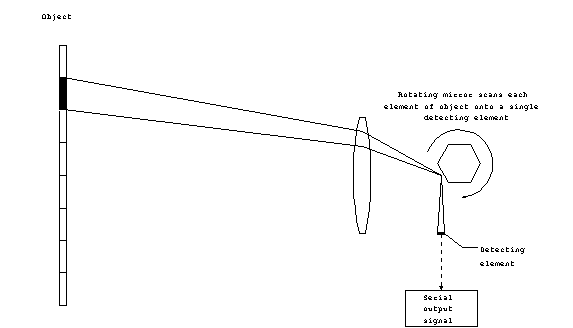
Figure 6. Scanning (serial
scan) system.
Since only the IFOV is directed on the detector at any one time,
the output of the scanning system is serial. For a scanning
system, the dwell time is determined not only by the frame rate,
but also by the total number of elements (or pixels) in one complete
image. For example, the 640x400 pixel image of the standard VGA
monitor uses 1/256,000 the dwell time as compared to an equivalent
staring system. The reduced dwell time increases the electrical
bandwidth (recall the BW 1/2t relationship),
which can in turn increase the noise in the system.
Resolution
Spatial Resolution
The spatial resolution of an imaging system is its ability
to distinguish separate objects or parts of an object within its
field-of-view. The smallest image element is determined by the
IFOV. There may be different vertical (VIFOV) and horizontal
(HIFOV) instantaneous fields-of-view. For an object at some range,
R, from the detector, the IFOV will encompass some length. For
example, if the IFOV = 1 mrad, then at 1000 m, the instantaneous
field-of-view will cover 1 m in length. The spatial extent of
the IFOV at object range R is estimated (for small angles) by
height: Dh R x VIFOV
width: Dw R x HIFOV
Equation
5Equation 6
Example: find the spatial resolution at 500m of a staring sensor
with a FOV = 100 x 100 using a 100 x 100
detecting element focal plane array.
Since the FOV in either direction is 100, the IFOV
is just 1/100 th or:
HIFOV= VIFOV = 0.10 = 1.7 mrad
At 500 m,
Dh = Dw
= 500 m (0.0017) = 85 cm
Thermal Resolution
For infrared imaging systems, which detect the thermal
radiation from objects, an important measure of performance is
its ability to detect small changes in temperature. The smallest
temperature difference a system can detect (and therefore can
display differently) is called the thermal resolution. Changes
which are too small to be distinguished from the background noise
in the system will not be detected. Sometimes thermal resolution
is described by NETD, which stands for noise-equivalent-temperature-difference.
NETD is the temperature change which changes the collected flux
by an amount equal to the noise-equivalent-power (NEP).
The thermal resolution (or NETD) can be improved by increasing
the size of the detecting elements, since more flux will be collected
by each. Unfortunately, this would degrade the spatial resolution,
by increasing the IFOV. As a general result (which is not proven
here) the thermal and spatial resolution are inversely proportional.
Spatial and Thermal Resolution, MRTD
Since it is not possible to simultaneously achieve high
spatial and thermal resolution, neither is a good measure of the
overall IR imaging system performance. A single quantity, called
the minimum resolvable temperature difference, MRTD, measures
both performance factors simultaneously. MRTD is determined experimentally
and therefore takes into account all of the various theoretical
and real-world factors that matter. The measurement is done by
slowly heating a test pattern at some range from the detector.
The target is shown below:
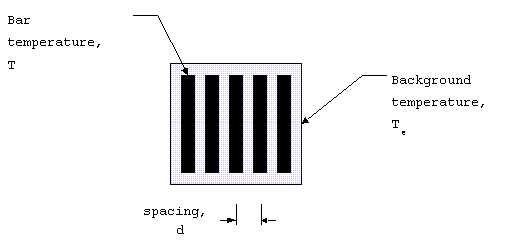
Figure 7. MRTD target.
From one bar to another is a single cycle of the test pattern
(like waves). Since the spacing is d, the spatial frequency is
1/d with units of cycles/m. Since the spatial extent is related
to the IFOV by the range, the spatial frequency can be expressed
as cycles/mrad calculated from 1000/(R d).
MRTD is the temperature difference at which bars first
becomes visible against the background. MRTD has units of oC
at at a given spatial frequency (in cycles/mrad). MRTD combines
both spatial and thermal resolution into a single quantity that
can be used to compare systems.
Example: MRTD = 0.05oC at 0.5 cycles/mrad,
compute the thermal and spatial resolution at 1000 m.
The thermal resolution is 0.05o, which represents that
smallest temperature change that can be detected, at any range.
The spatial resolution can be calculated from equations (5) and
(6). First compute the IFOV:
IFOV = 1/0.5 cycles/mrad = 2 mrad.
Therefore at R = 1000m, the spatial resolution is
Dw = R x IFOV = (1000 m) x (0.002)
Dw = 2m.
Infrared Search and Tracking (IRST) Systems
A passive infrared tracking system has the additional
complication of range determination. Unlike radar, which can
measure the range directly, the passive system must use other
means. There are two main ways in which range information is obtained:
triangulation and in combination with a laser range-finder.
Triangulation (passive)
This requires two or more sensors, preferably very far apart.
The accuracy of the system improves with the separation distance.
What is required is a difference in measured bearing, Dq,
to the target from the two sensors which are separated by distance
d.
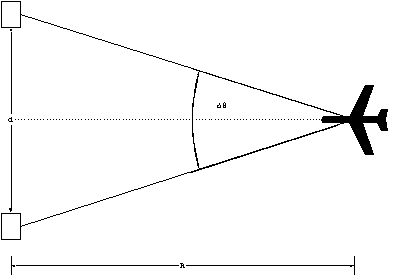 Figure 8. Triangulation.
If the sensors are spaced along a line perpendicular to the direction
of the target, the range is determined by:
R = d/2tan(Dq/2)
Equation 7
The limit of the system is reached when the difference in bearing
is equal to the HIFOV, therefore the maximum range at which the
system can function is
Rmax = d/2tan(HIFOV/2)
Equation 8
Example: suppose the HIFOV is 1 mrad (0.06o) and the
sensors are spaced by 10 m, find the maximum triangulation range.
Rmax = 10/2tan(0.06o/2) = 9500 m.
Laser range-finder (passive-active combination)
The laser operates in a pulsed mode, and obtains the range in
an identical manner to a pulsed radar system. This can be used
for continuous range tracking when combined with the bearing and
elevation tracking from the IR system. Since the laser beam has
a very small beamwidth, it is necessary to use the bearing and
elevation tracking to aim the laser at the target. The laser
range finder will have the parameters of PW and PRF just like
radar, with the same implications. For example, minimum and maximum
unambiguous range. However, the pulsed laser range finder is
generally unsuitable for Doppler measurement because the first
blind speed is very low (order of cm/s).
Visible Band Imaging Systems
Thermal radiators at reasonable temperatures all emit energy
in the infrared band. In order for the radiation to be in the
visible band requires temperatures akin to the surface of the
sun. Therefore, detectors that operate in the visible band (0.4
to 0.7 mm) cannot be used to detect
thermal radiation. They can, however, improve upon normal human
eyesight. There are two main things that visible imaging systems
can improve upon: magnification and light amplification.
Magnification
We are all undoubtedly familiar with magnifying system
like binoculars and telescopes. These can also be thought of
as parts of weapons systems. For example, the scope on a rifle,
or the periscope on a submarine. In fact, these can provide highly
accurate bearing, elevation and range which is all you could ask
of any weapons sensor.
The magnification for a simple thin lens can be derived
by the following construction:
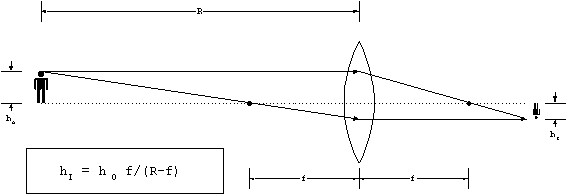
Figure 9. Transverse magnification.
For relatively long ranges, where R >> f, this simplifies
to hI = hO f/R. The transverse magnification
is the ratio of the image to the object:
MT hI/hO f/R, for R>>f
Equation 9
To make a telescopic sight, or scope, two lenses are combined:
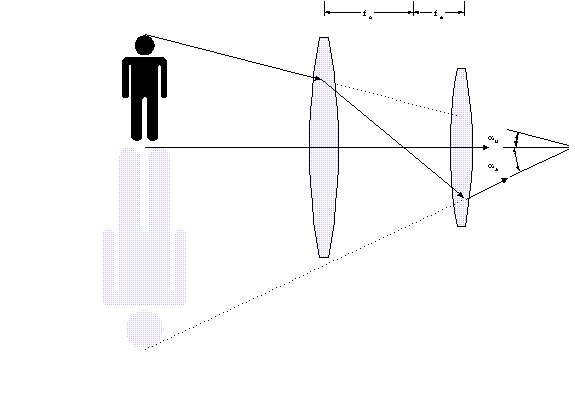
Figure 10. Angular magnification.
If the object subtends an unaided viewing angle, au,
then the combination of lenses alters the incoming rays
so that they appear to subtend an aided viewing angle, aa.
When aa is larger than
au, the object appears larger
and is therefore magnified. The angular magnifying power, MP,
is defined by
MP aa/
au
Equation 10
The correct combination is achieved by placing the focal
point of the objective lens at the focal point of an eyepiece
lens. When this is done, the relationship between the focal lengths
of the objective and eyepiece lens will determine the magnification
power. If we consider rays coming in from a great distance, the
relationship can be constructed:

Figure 11. Magnifying
power.
The magnifying power is found from
MP = aa/
au = tan-1(DF.S. /2fo)/tan-1(DF.S./2fe)
As long as we are only considering small viewing angles (unlike
the illustration), which is normally the case the magnification
power is
MP fo/fe
If the aperture stop of the objective optics is Do,
the image size of the objective after it passes through the system
will be De. Therefore
MP = fo/fe = Do/De
Equation 11
Binoculars and telescopes are specified by the two-number combination:
MP x Do (in mm). For example, 7x50 binoculars have
MP = 7 and Do = 50 mm. The larger the objective diameter,
the better the performance in low light situations. The field-of-view
is controlled by the field stop. Generally binoculars have a
set field-of-view which is about 80. You may also
have noted that this simple system would result in an inverted
image. In practice, this is corrected by an erecting system between
the objective and eyepiece lenses.
Stadimeter Ranging
Range can be obtained from a strictly passive visible-light
optical system only if the size of the object is known. The principle
if based on trigonometry (again!). Suppose we have and object
with height, h, at some unknown range, R. If the angular extent
of the object is measured to be q,
then the range can be determined from
R = h/tan(q)
Equation 12
Of course, this result is not particularly handy since
it would require a calculator. This result is commonly used when
the angle is small, for example 10. If we express
the angle in radians, then the small angle approximation can be
used,
tan(q) q
which converts the stadimeter range equation into
R h/q,
angle in radians
or more if the angle is in degrees, then
R 60h/q, angle in degrees.
An object 100 feet tall will subtend 1o at 1
nautical mile
This can be used to derive the handy thumbrule:
For other heights or angles the range can be found by taking a
ratio.
Example: Using binoculars with an 8o field-of-view,
you observe a 1200 ft. tower which fills one-quarter of the FOV.
Find the range to the tower.
The angle is 20, which is one-quarter of 8o.
If a 100 ft. tower subtends 1o at 1 nm, then it would
subtend 20 at 0.5 nm.
The 1200 ft, tower subtends 20 at 12 x 0.5 nm, or 6
nm.
R = 6 nm.
Another example: periscope ranging.
Most periscopes have an 8o field-of-view in high-power.
The optics has 32 vertical marks used for ranging. Each division
is 1/40 and therefore, the typical ship with a masthead
at 100 ft, will subtend one division when it is at 4 nm.
Light Amplification
So called low-level-light (LLL) systems are designed to
enhance the light which is reflected from targets. Unlike infrared,
LLL systems require some background illumination in order to function.
These systems only amplify what is already there from external
sources like moon or star light. The output from the eyepiece
of an ordinary scope is put into an image intensifying tube.
This consists of three parts:
Photocathode. The incoming light causes the photocathode to give
off electrons.
Electrodes. These are pairs of plates at a high voltage difference,
so that the electrons are accelerated between them. The electrons
move from the cathode to an anode. In order to achieve high gain,
in between are placed dynodes, which act as both anode and cathode.
The electrons are collected from the photocathode at the first
dynode. This causes the emission of secondary electrons, which
in turn are accelerated again. Each pair of dynodes acts as a
stage, and at each stage, the total number of electrons in increased.
Phosphorus plate. After the number of electrons has been increased
many times, a phosphorus plate is placed just at the other end
from the photocathode. When the electrons strike the plate, it
emits light. Typically the light is green. Gain is achieved by
increasing the number of electrons in stages. Using many stages,
the light can be increased by over 30,000 times what came into
the detector.
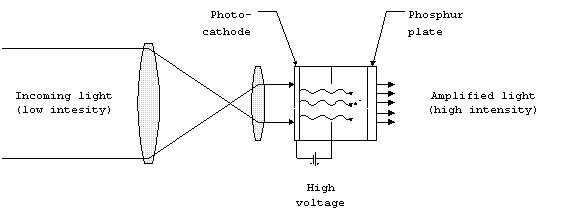
Figure 12. Image intensifying
system.
LLL systems intensify the amount of light already present. They
will not work if there is no light present. Additionally, they
can become saturated if too much light is present.
The resolution of the LLL system is determined by the
size and number of detecting elements. As a general rule, the
resolution varies inversely with the sensitivity. For example,
using many stages, the number of electrons reaching the phosphorus
plate can be increased greatly. When the electrons reach the
plate, it will be difficult to finely focus this hoard of electrons
back into the small elements of the image without any overlap
or interference. Another way to improve sensitivity would be
to collect more light at the entrance (objective lens) by increasing
the aperture stop. This, however, would affect the depth of focus.
Low-level-light systems are not suitable for precise imaging
by the very nature of their operation, so it is not a big deal
if the image quality is low. What is needed is the detection
of the presence of objects such as troops, or vehicles.
LLL systems may be combined with their own light sources
for use in conditions where no ambient light exists, for instance
inside of buildings. Of course, the system is no longer passive
and its use can be detected. Furthermore, LLL systems can be
combined with narrow beamwidth laser light sources, which can
produce a bright reflection off the target in order to provide
accurate weapons sighting.
Laser Target Illumination
Since laser light has a narrow beamwidth it is well-suited
to precise measurement. A laser tracking system, using the same
design as the radar servo tracking system, would be extremely
accurate. As an added benefit, the reflected beam can be used
to guide weapons into the target. When used in this manner, the
laser servo tracking system is called an target illuminator.
Target illumination can be provided by either the weapon itself,
or more commonly, by a third party.
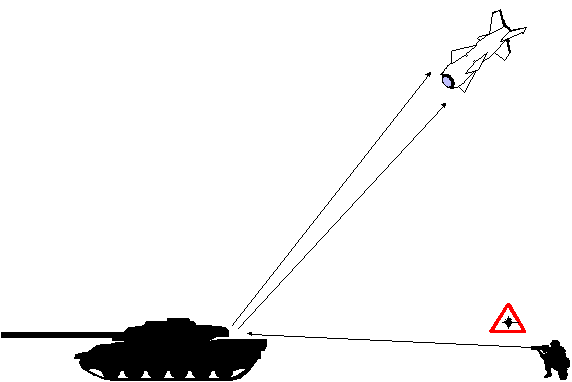
Figure 13. Target illumination.

 Introduction to
Naval Weapons Engineering


 Figure 8. Triangulation.


