 Damage Control Training
Stability and Buoyancy Lessons
 Damage Control Training
LESSON TOPIC: 4.2 TITLE: SOLID WEIGHT SHIFTS, ADDITIONS AND REMOVALS
Contact periods allotted this LESSON TOPIC:
Classroom: 2.5 Test: 0.0
Trainer: 0.0 Total: 2.5
MEDIA: Classroom lecture with visual media
TERMINAL OBJECTIVES:
6.0 EVALUATE shipboard stability by analyzing weight and moment considerations. (JTI 3.2.1, 6.0, 6.1, 6.2)
ENABLING OBJECTIVES:
6.7 DESCRIBE the movement of stability reference points as a function of weight shifts, additions and removals.
6.8 DESCRIBE the impact on stability caused by the addition, removal, or shift of weight.
6.9 Given a summary of shipboard weight groups and their locations relative to the keel and midships perpendicular, CALCULATE the vertical and transverse position of the ship's center of gravity.
6.10 Given a specified loading condition and a ship's DC book, CALCULATE the sine and cosine corrections caused by a weight addition, removal or shift.
6.11 Given a ship's DC book, PREPARE, LABEL, and apply sine and cosine corrections to an uncorrected statical stability curve.
VERTICAL WEIGHT SHIFTS
Shifting weight vertically, no matter where onboard it is, will always cause the ship’s center of gravity to move in the same direction as the weight shift.
To calculate the height of the ship’s center of gravity after a vertical weight shift, the following equation is used:
|
|
||
KGO
= The original height of the ship’s center of gravity (FT)WO
= The ship's displacement prior to shifting weight (LT)w
= The amount of weight shifted (LT)kg
= The vertical distance the weight was shifted (FT)WF
= The ship’s displacement after shifting the weight (LT)±
= When the weight is shifted up use (+)When the weight is shifted down use (-)
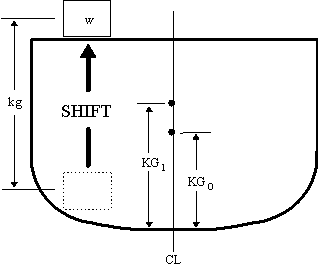
Example Problem
10 LT of ammunition are shifted up 30 FT. WO is 3500 LT and KGo is 18.5 FT. What is the new height of the ship’s center of gravity (KG1)?
![]()
VERTICAL WEIGHT ADDITIONS/REMOVALS
When weight is added or removed to/from a ship, the vertical shift in the center of gravity is found using the same equation.
|
|
||
KGO
= The original height of the ship’s center of gravity (FT)WO
= Ship's displacement prior to adding/removing weight (LT)w
= The amount of weight added or removed (LT)kg
= The height of the center of gravity of the added/removed weight above the keel (FT)WF
= The ship’s displacement after adding/removing the weight±
= When the weight is added use (+)When the weight is removed use (-)
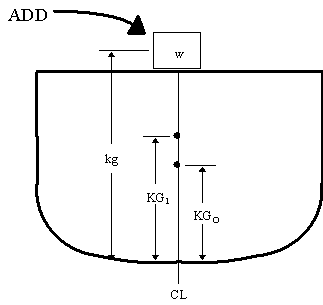
Example Problem
A 30 LT crate is added 35 FT above the keel. W0 is 3500 LT and KG0 is 18 FT. What is the new height of the ship’s center of gravity (KG1)?
![]()
SINE CORRECTION
From Lesson 4.01, when the ship's center of gravity is shifted vertically, the length of the righting arm is affected. The Sine Correction is applied to the Righting Arm Curve to reflect the increase/decrease in GZ.
|
|
|
When gravity rises from position G to position G1, the righting arm is reduced from length GZ to length G1Z1. The distance the righting arm was reduced is shown by length GT.
The value of length GT varies by the sine function of the angle of inclination. To correct the righting arm curve, the Sine Correction curve is plotted using the equation:
![]()
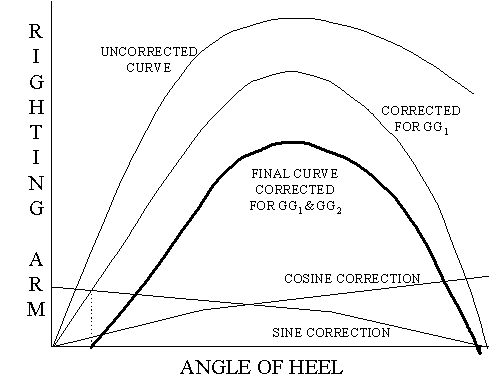
The Sine Correction curve is applied directly to the righting arm curve, and indicates exactly how much righting arm has been lost due to the higher position of G throughout the range of stability.
For this example, GG1 is 0.25FT. When plotting the Sine Correction curve, instead of plotting points for all degrees of heel, remember these three rules:
1. Sine 0
° = 0, therefore the Sine Correction at 0° is: ![]()
2. Sine 30
° = 0.5, therefore the Sine Correction at 30° is: ![]()
3. Sine 90
° = 1.0, therefore the Sine Correction at 90° is: ![]()
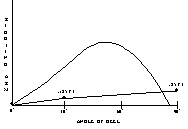
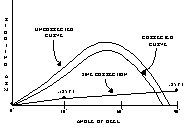
Connect the three points with a straight edge. The region between the Sine Correction curve and the original curve (known as the uncorrected curve) represents the remaining righting arms.
There are two methods to draw the corrected righting arm curve:
1) Using dividers, place the upper end on the uncorrected curve and the lower end on the Sine Correction curve. Next, move the lower end of the dividers down to the base line of the graph and plot a point at the upper end of the dividers. Repeat this process every ten degrees and connect the dots.
2) Using dividers, place the upper end on the Sine Correction curve and the lower end on the baseline of the graph. Next, move the upper end of the dividers up to the uncorrected curve. Plot a point at the lower end of the dividers. Repeat this process every ten degrees and connect the dots.
HORIZONTAL WEIGHT SHIFTS
Shifting weight horizontally, no matter where onboard it is, will always cause the ship’s center of gravity to move in the same direction as the weight shift. NOTE: A weight shift causing the ship’s center of gravity to move off centerline will always reduce the stability of the ship.
To calculate the horizontal movement of the ship’s center of gravity, the following equation is used:
|
|
||
w
= The amount of weight shifted (LT)d
= The horizontal distance the weight is shifted (FT)WF
= The ship’s displacement after the weight is shifted (LT)
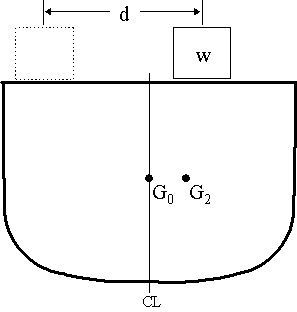
Example Problem
A 50 LT weight is shifted 40 FT to starboard. WO is 3200 LT.
What is the change in the center of gravity (GG2)?

HORIZONTAL WEIGHT ADDITIONS/REMOVALS
When an off-center weight is added or removed to/from a ship, the ship’s center of gravity will move off centerline, the ship will develop a list.
To calculate the horizontal movement of the ship’s center of gravity after adding/removing an off-center weight, the same equation is used:
|
|
||
w
= The amount of weight added/removed (LT)d
= The distance from the center of gravity of the weight to the ship’s centerline (FT)WF
= The ship’s displacement after the weight is shifted (LT)
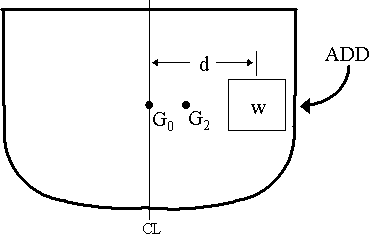
Example Problem
50 LT of stores is loaded onto the flight deck, 30 FT from centerline. WO is 4800 LT. What is the change in the center of gravity (GG2)?

COSINE CORRECTION
When the ship's center of gravity is shifted off centerline, the length of the righting arm is affected. The Cosine Correction is applied to the Righting Arm Curve to reflect the increase/decrease in GZ.
|
|
|
When gravity moves from position G to position G2, the righting arm is reduced from length GZ to length G2Z2. The distance the righting arm was reduced is shown by length GP.
The value of length GP varies by the cosine function of the angle of inclination. To correct the righting arm curve, the Cosine Correction curve is plotted using the equation:
![]()
The Cosine Correction curve is applied directly to the righting arm curve, and indicates exactly how much righting arm has been lost due G located off centerline, throughout the range of stability.
For this example, GG2 is 0.50FT. When plotting the Cosine Correction curve, instead of plotting points for all degrees of heel, remember these three rules:
1. Cosine 0
° = 1.0, therefore the Cosine Correction at 0° is: ![]()
2. Cosine 60
° = 0.5, therefore the Cosine Correction at 60° is: ![]()
3. Cosine 90
° = 0, therefore the Cosine Correction at 90° is: ![]()

Connect the three points with a straight edge. The region between the Cosine Correction curve and the original curve (known as the uncorrected curve) represents the remaining righting arms.
The righting arm curve can be corrected with the Cosine Correction curve using either of the methods listed for correcting the sine curve.
Whenever weight is added or removed to/from a ship, the ship’s center of gravity rarely moves in only one direction. Fortunately, the effects are cumulative. First, calculate the vertical shift in the center of gravity and correct the statical stability curve using the sine correction. Next, calculate the horizontal shift in the center of gravity and correct the once corrected statical stability curve with the cosine correction. The result is the final statical stability curve.
STABILITY DATA CALCULATION SHEET
It is often desirable to consider the effects of several weights at once when calculating the vertical and horizontal changes of the ship’s center of gravity. The Stability Data Calculation Sheet is a tabular form used to calculate the net vertical and horizontal moments created by several weight movements.
DIRECTIONS FOR USE
ORIGINAL CONDITIONS:
1. Displacement (WO) is found using the draft diagram and functions of form. (LT)
2. KGO is found in section II(a) of the DC Book, in the summary of the loading condition you are closest to. (FT)
3. Free Surface Effect in the ship’s tanks is found in section II(a) of the DC Book, in the summary of the loading condition you are closest to. (FT)
4. Assumed Center of Gravity (KGA) is found at the top of the cross curves of stability. (FT)
COLUMNS 1 THROUGH 10:
1. Self explanatory.
2. Is the weight added/removed from the port, starboard, or centerline. If the weight is shifted, indicate the direction shifted. (P, S, CL)
3. Compartment volume (Length x Breadth x Depth) (FT)
4. Weight added, removed, or shifted. If due to flooding, divide the compartment volume by 35 FT3/LT for saltwater, or 36 FT3/LT for fresh water. (LT)
5. For weight additions/removals, distance from the keel to the center of gravity of the weight. For weight shifts, the vertical distance shifted. (FT)
6. For weight additions/removals, distance from the ship’s centerline to the center of gravity of the weight. For weight shifts, the horizontal distance shifted. (FT)
7. Multiply columns 4 and 5. For weight additions or upward weight shifts, place the answer in column 7a. For weight removals or downward weight shifts, place the answer in column 7b. (FT-Tons)
8. If the compartment is not flooded 100%, calculate the Free Surface Effect. (FT)
9. If the compartment is not flooded 100%, is open to the sea, and is off centerline or asymmetrical about centerline, calculate the Free Communication Effect. (FT)
10. Multiply columns 4 and 6. If the weight addition, removal, or shift would cause the vessel to list to starboard, place the answer in column 10a. If the weight addition, removal, or shift would cause the vessel to list to port, place the answer in column 10b. (FT-Tons)
FINAL CONDITIONS:
1. Final Displacement (WF) is found by adding/subtracting the net column 4 weights. (LT)
2. Net Vertical Moment (NVM) is the difference between the totals of column 7a and 7b. If the total of column 7a is greater, NVM is positive (+). If the total of column 7b is greater, NVM is negative (-). (FT-Tons)
3. Solve the KG1 equation using the Net Vertical Moment. (FT)
4. Calculate Total Virtual Rise in gravity by adding columns 8 and 9 and any Free Surface in the ship’s tanks. (FT)
5. KGF is found by adding KG1 and any virtual rise of gravity. This is used to help plot the righting arm curve. (FT)
6. The Sine Correction (GG1) is the total vertical change in the ship’s center of gravity. (FT)
7. The Net Inclining Moment (NIM) is the difference between the totals of columns 10a and 10b. If the total of column 10a is greater, the ship will list to starboard, if column 10b is greater, the ship will list to port. (FT-Tons)
8. The Cosine Correction (GG2) is the total horizontal change in the ship’s center of gravity. (FT)
|
|
GIVEN:
Draft FWD: 14 FT 4 INAFT: 15 FT 7 IN
KGO: 19.0 FT
F/STANKS: 0.36 FT
FIND:
WFSine Correction (GG1)
Cosine Correction (GG2)
Final Maximum Righting Arm
Angle of List